Blog

us.jpg   fr.jpg

Price/earnings ratio comparison since 2000

106.png

MSCI EAFE value & growth indices

105.png

How five-star funds performed over time

104.png

Average annual real returns in years with above-median US inflation, 1927-2021

103.png

Does value last year tell us about this year?

102.png

US personal savings rate (average - 1959-2022)

101.png

Asset class returns in an inflation cycle

100.png

US and Euro investment grade yields - highs not seen in a decade

98.png

US convertible default rates remain low over long term

97.png

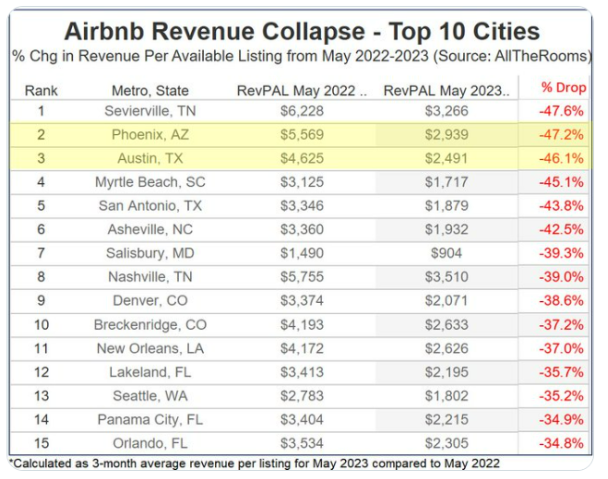
The home price correction is sharpest out west

96.png

Syndicate content