Blog

us.jpg   fr.jpg

Maximum sustainable withdrawal rates for retirees

Picture39.png

Asset class total returns since 2011

Picture37.png

How much Americans get in social security benefits

Picture36.png

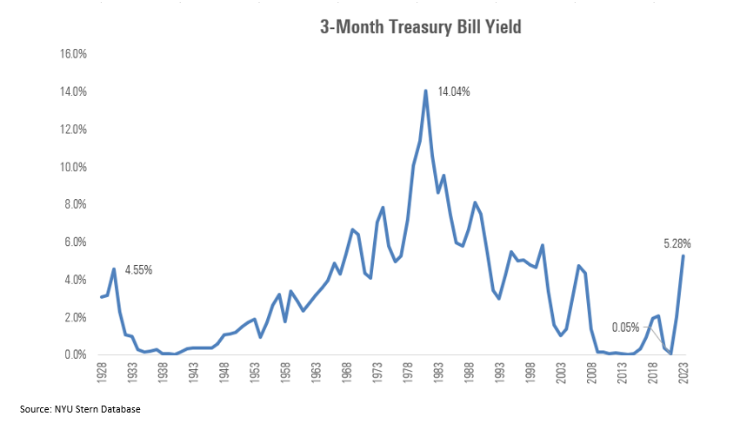
10 year-3 month treasury yield spread since 1960

Picture35.png

Spending methods summary, 50% equity/50% bond, 30 years and 90% success rates

Picture34.png

Median household net worth by age

Picture33.png

30-year starting safe withdrawal rate %, by asset allocations

Picture32.png

Bloomberg US aggregate bond index: Longest drawdowns since 1976

Picture31.png

S&P 500 rolling one year: Returns: 1926-2023

Picture28.png

Over the past 20 years, a diversified portfolio consistently avoided low risk-adjusted returns

Picture27.png

Syndicate content