Blog

us.jpg   fr.jpg

U.S. Yield Curve vs. Unemployment Gap, 1953-2018

U.S. Yield Curve vs. Unemployment Gap, 1953-2018.PNG

The Historical Decline of Global Financial Risk from 1981 to 2011

The Historical Decline of Global Financial Risk from 1981 to 2011.PNG

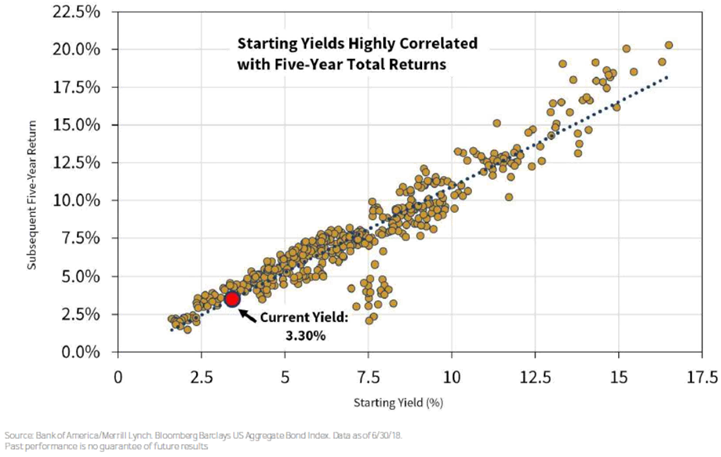
Forward-looking Returns Are Closely Correlated to Starting Valuations

Forward-looking Returns Are Closely Correlated to Starting Valuations.PNG

The Highest Return Potential Is Outside U.S. Stocks and Bonds

The Highest Return Potential Is Outside U.S. Stocks and Bonds.PNG

The Current CAPE Ratio

The Current CAPE Ratio.PNG

Number of Months from Growth Trough to Growth Peak in US Cycles since 1900

Number of Months from Growth Trough to Growth Peak in US Cycles since 1900.PNG

Number of Years until a New Technology was Used by 25% of the US Population

Number of Years until a New Technology was Used by 25% of the US Population.PNG

$200,000 Investment Year 2000

$200,000 Investment Year 2000.PNG

Stock Returns Have Stayed Healthy After Mild Curve Inversions

Stock Returns Have Stayed Healthy After Mild Curve Inversions.PNG

Stock Returns Have Stayed Healthy After Mild Curve Inversions

Stock Returns Have Stayed Healthy After Mild Curve Inversions.PNG

Syndicate content