Blog

us.jpg   fr.jpg

MSCI emerging markets less S&P 500 index since 1991

7.png

Distribution of historical stock and bond returns since 1876

6.png

Year-to-date total return for the Bloomberg US aggregate index

4.png

Starting 3-year treasury yield and annual change in Fed funds rate since 1972

5.png

Previous value cycles show the potential for prolonged outperformance

3.png

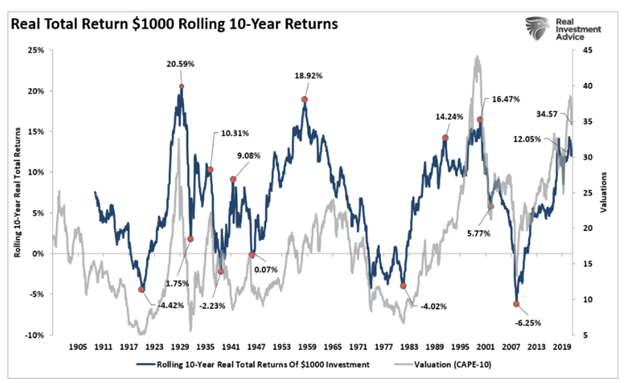
10-year nominal total return since 1900

2.png

Dow Jones: 18 years flat between 1964 and 1982

1.png

The historic crypto bubble: Bitcoin is now the 5th biggest wipeout of all time

Picture275.png

Syndicate content