Blog

us.jpg   fr.jpg

S&P 500, 10-year treasury, and 3 month T-bill returns and inflation rate of periods 1977-1999 and 2000-2022

73.png

Yield on bonds versus stocks at highest level in 11 years

71.png

60/40 prospective returns are near historic lows since 1900

70.png

When the Russell 2000 is down 30% or worse since 1979

69.png

Earnings growth and S&P 500 total returns for each decade since 1930

68.png

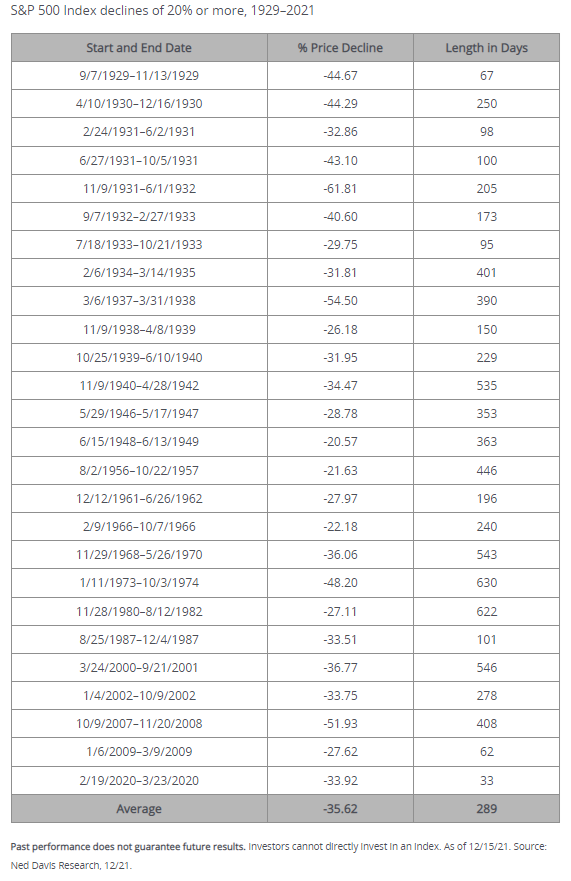
When the S&P 500 is down 25% or worse since 1950

67.png

Starting yields vs. 10-year annual returns for 10-year treasuries: 1928-2021

66.png

Relative valuation of cheapest 50% of stock market vs. expensive less average since 1981

65.png

Proportion of funds that outperformed and underperformed their respective benchmarks during the initial periods

64.png

Over the long-term, moderate levels of inflation have been normal since 1750

63.png

Syndicate content