Blog

us.jpg   fr.jpg

Average investor allocation to equities vs. 10-year forward annualized price return since 1951

138.png

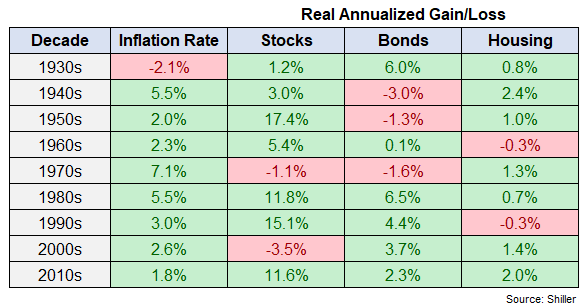
Real total return $1000 rolling 10-year returns since 1905

137.png

Family office allocations

136.png

Asset allocation by institutional segment

135.png

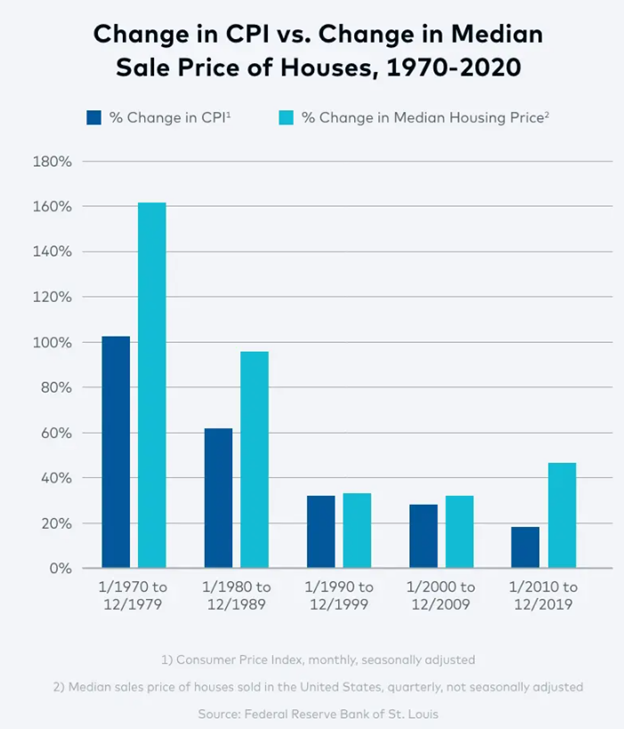
Case-Shiller US national average home price index 2-year change since 1989

134.png

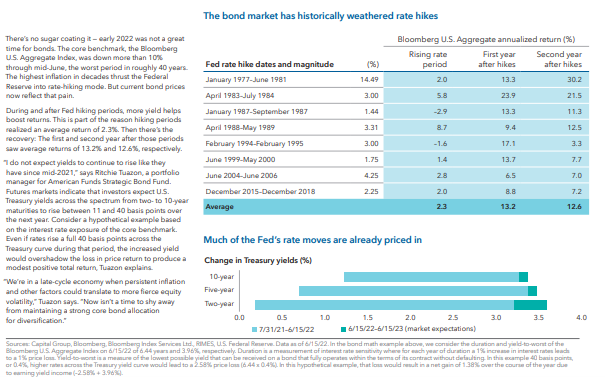
Bloomberg aggregate bond index yield and forward 6-year annualized return

133.png

Bloomberg Barclays aggregate total return by year since 1977

132.png

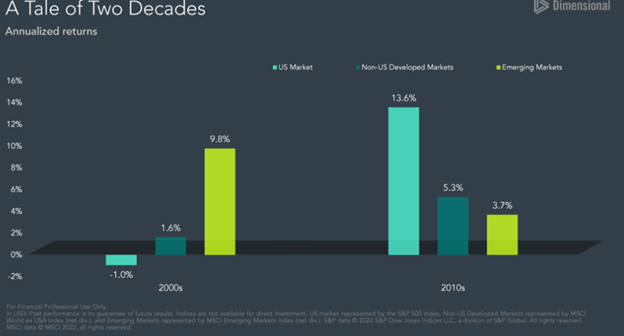
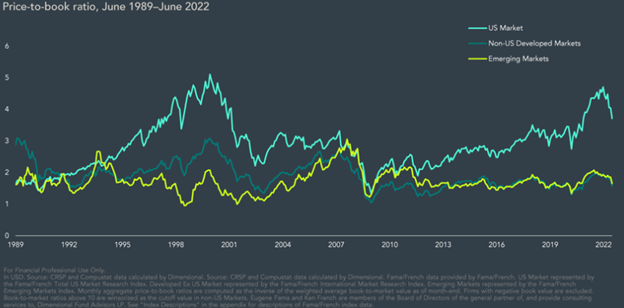
S&P 500/emerging markets since 1991

131.png

Nasdaq 100 relative to S&P 500 since 1996

130.png

US aggregate yield and forward returns since 1976

129.png

Syndicate content