Blog

us.jpg   fr.jpg

Annual total return for balanced portfolio of US taxable bonds since 1980

254.png

US bull and bear markets since 1966

253.png

Case-Shiller home price index during recessions since 2002

252.png

Consumer price index for all urban consumers since 1915

251.png

Things you can vs. cannot control

250.png

Monthly turnover and annual performance

249.png

20-year annualized returns by asset class (2001-2020)

247.png

The Dalbar study: 30 years of average equity fund investor vs. indexes (1/1/1992 - 12/31/2021)

246.png

Five reactions to 10% inflation in 1979

244.png

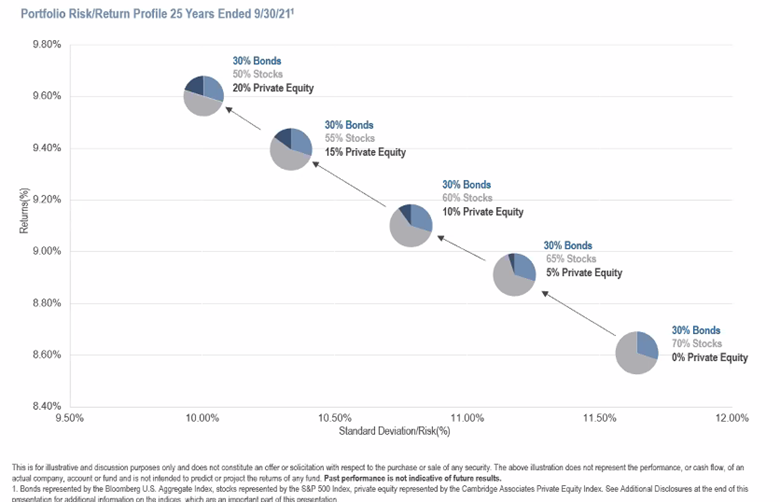
Private equity: Assets under management, 2009-2021

243.png

Syndicate content